
Africa Knowledge Management Portal
Informing health decisions and actions
Description
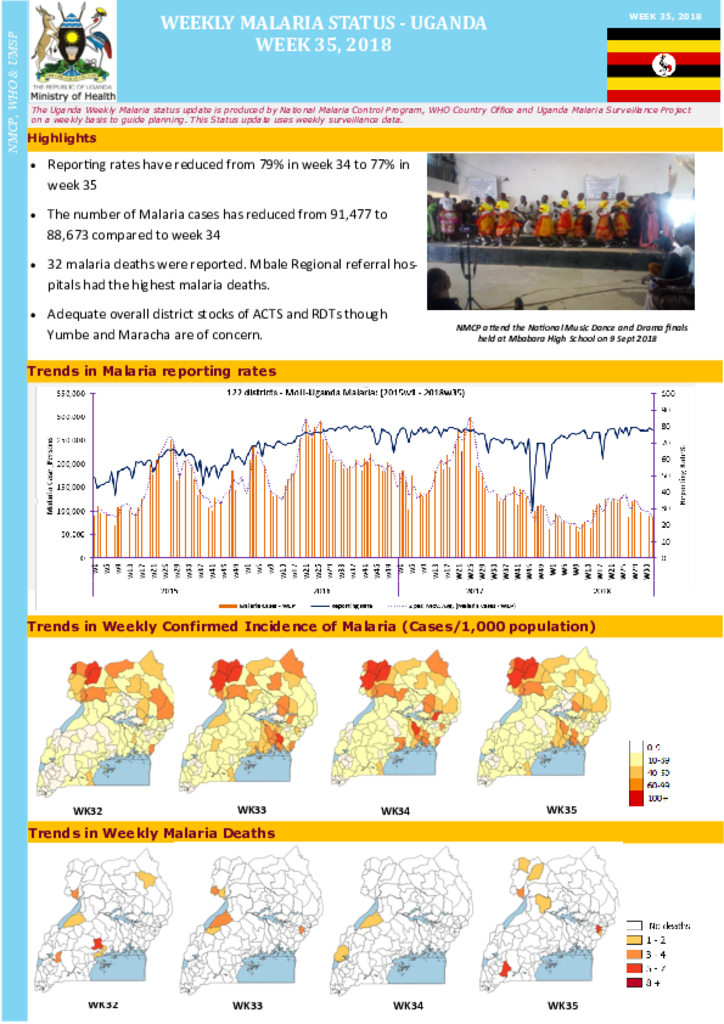
Confirmed Malaria cases per 1000: (Number of Malaria cases positive by microscopy and RDT/ district population )x 1000�Total Malaria cases per 1000. (Number of Confirmed + Presumed malaria cases) / district population)*1000 �Malaria Deaths: Number of Malaria deaths per week��% of Test Negative Treated: Proportion of those who tested negative that are treated.��Test Positivity rate- Number of malaria positive tests (RDT + Microscopy) / Number tested by RDT and Microscopy ACT Stock available: Overall ACT stock available at district level compared expected weekly total malaria cases.��RDT Stock available: Overall RDT stock available at district level compared to expected weekly suspected fevers.�Proportion of Health facilities reporting ACT stock outs: Number of Health facilities with ACT stock out/ Number of facilities reporting